Audio generated by DropInBlog's Blog Voice AI™ may have slight pronunciation nuances. Learn more
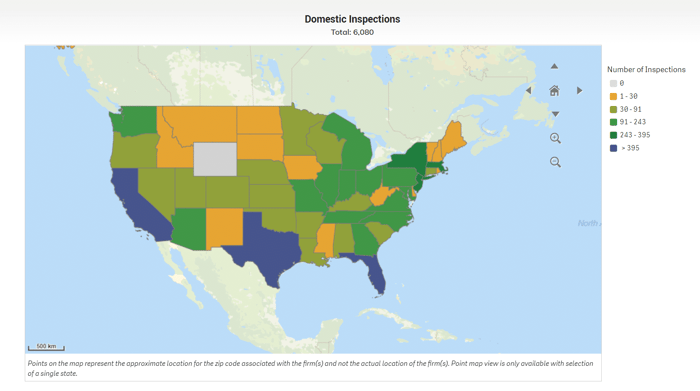
Last year, FDA added data visualization tools to its inspections database. Users can apply filters for year, project area, geographic area, product type, and classification to generate charts and graphs detailing inspections performed per year, inspection classifications per year and product type, and top citation types. There's even a cool map that shows inspection volumes in different states. (Texas, California, and Florida, unsurprisingly, are BIMO inspection hotspots; Wyoming has not seen a BIMO inspection in the past 12 years!)
The visualizations are produced using two datasets, both of which can be downloaded from this page.
The Inspections Details dataset, currently weighing in at 17 MB, has the following data:
Inspection ID
FDA Establishment Identification (FEI) Number
Inspectee name and and geographic area
Product Type (Biologics, Devices, Drugs, Food/Cosmetics, Tobacco, or Veterinary)
Project Type (25 classifications, including Bioresearch Monitoring, Drug Quality Assurance, and Postmarket Surveillance and Epidemiology)
Inspection end date and fiscal year
Classification (No Action Indicated, Voluntary Action Indicated, or Official Action Indicated)
The Citations Dataset, a slimmer 9 MB, includes the following:
Inspection ID
FEI Number
Inspectee name
Program Area (Biologics, Foods, Devices, Drugs, Human Tissue, Bioresearch Monitoring, Part 11 Compliance, Parts 1240 and 1250, Radiologic Health)
Regulation cited
Short description of citation
Long description of citation
The combined datasets are a treasure trove of information, but one significant limitation is the lack of differentiation between inspectee types. In the BIMO program area, for example, there is no simple way to distinguish among inspections of sponsors, investigators, sponsor-investigators, CROs, IRBs, or labs.
Because we love charts, graphs, and maps, we're going to take a stab at classifying inspectees to see what we can learn about trends in inspection findings. Stay tuned!