We continue our series on the history of quality with a name most of you will recognize: Kaoru Ishikawa.
Ishikawa's career paralleled that of Demings and Juran, albeit on the other side of the Pacific. After graduating from the University of Tokyo with an engineering degree he served in the Japanese navy during World War II, after which he taught at his alma mater. In 1959, he joined the Japanese Union of Scientists and Engineers, where he adopted and expanded upon the practices that Demings and Juran brought to Japan.
Ishikawa developed the concept of the "quality circle," a small group of employees working in the same functional area who meet periodically to solve problems and enhance productivity. The quality circle echoes the concept of having employees, rather than management, be responsible for quality.
Ishikawa popularized seven quality improvement tools that quality circles used to analyze problems. The Ishikawa diagram, or fishbone diagram, is used to analyze root causes. The Pareto chart, a combination bar chart and cumulative line graph, helps users visualize the "80/20 rule," where 20% of the causes are responsible for 80% of the problems. Statistical process control charts, check sheets, histograms, scatter charts, and run charts are the other tools.
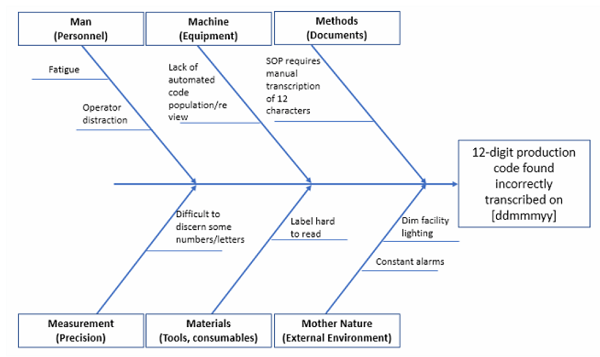
The Ishikawa diagram is a standard tool in root cause analysis in clinical research. It helps teams focus on one potential cause of a problem at a time. The six branches of the fishbone diagram can represent any six potential root causes, but as the diagram was popularized in a manufacturing setting, they frequently use common causes of manufacturing issues, represented by the acronym PEMME: People, Environment, Machine Method, Equipment.
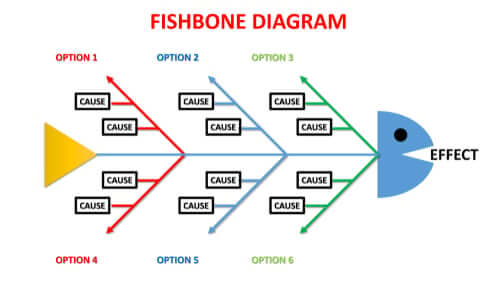
Fishbone diagrams are generated in a variety of styles. We start with a rather utilitarian example.
Here we have an abstract.
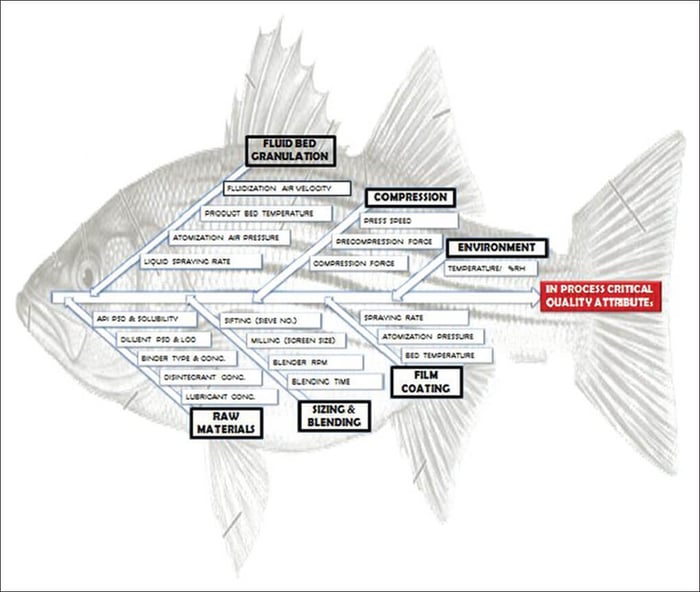
This team wants their fish to look like a FISH.
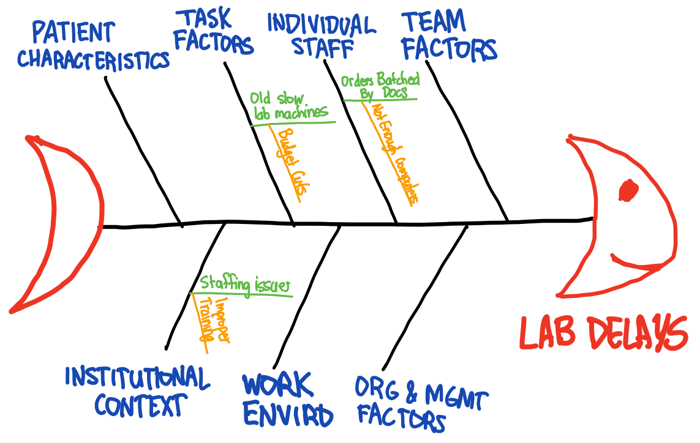
This one's giving "I brought my kids to work and let them draw on the whiteboard to keep them quiet."
And finally we have a meta-take on the process.
We find fishbone diagrams are useful for structuring brainstorming sessions, but if your fish faces left instead of right, we doubt you are ever going to find that root cause.
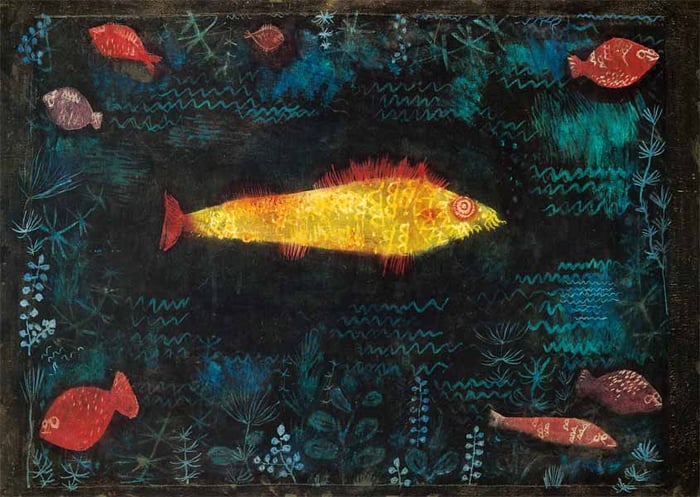
The featured image is a painting by Paul Klee titled The Golden Fish.